Overview
Purpose
The objective of the telemetry feature is to gather metrics and establish an infrastructure for visualizing valuable network insights. The metrics we at the Interledger Foundation collect include:
- The total amount of money transferred via packet data within a specified time frame (daily, weekly, monthly).
- The number of transactions from outgoing payments that have been at least partially successful.
- The average amount of money held within the network per transaction.
We aim to track the growth of the network in terms of transaction sizes and the number of transactions processed. Our goal is to use these data for our own insights and to enable Account Servicing Entities (ASEs) to gain their own insights.
Privacy and Optionality
Privacy is a paramount concern for us. Rafiki’s telemetry feature is designed to provide valuable network insights without violating privacy or aiding malicious ASEs. For more information, please read the privacy docs.
The telemetry functionality is currently enabled by default on test (non-livenet) environments, i.e. any environment that is not dealing with real money. When active, it transmits metrics to the “testnet” collector. In the future, those ASEs operating in a production “livenet” environment (real money) will be able to opt-in to sharing their metrics with a “livenet” collector. Regardless of environment, Account Servicing Entities (ASEs) can also opt-out of telemetry completely.
Architecture
The architecture of the telemetry feature is illustrated below:
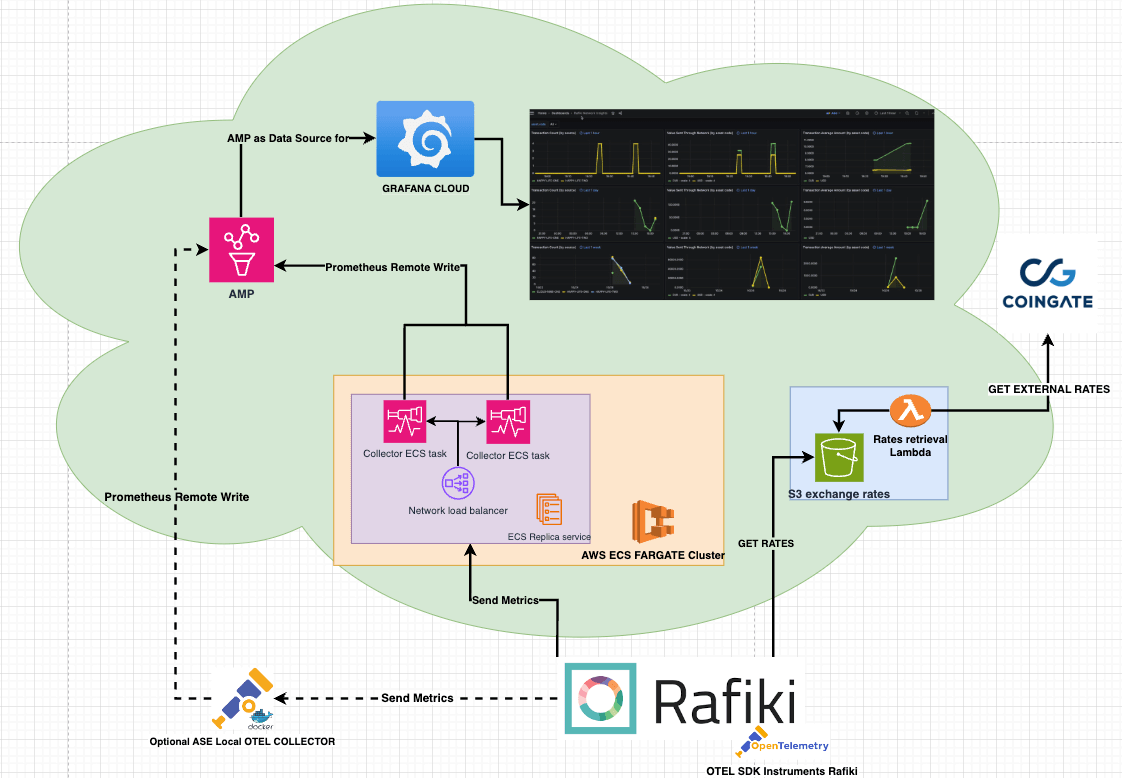
OpenTelemetry
We have adopted OpenTelemetry to ensure compliance with a standardized framework that is compatible with a variety of tool suites. This allows clients to use their preferred tools for data analysis, while Rafiki is instrumented and observable through a standardized metrics format.
Telemetry ECS Cluster
The Telemetry Replica service is hosted on AWS ECS Fargate and is configured for availability and load balancing of custom ADOT (AWS Distro for Opentelemetry) Collector ECS tasks.
When ASEs opt for telemetry, metrics are sent to our Telemetry Service. To enable ASEs to build their own telemetry solutions, instrumented Rafiki can send data to multiple endpoints. This allows the integration of a local Otel collector container that can support custom requirements. Metrics communication is facilitated through gRPC.
Otel SDK - Rafiki Instrumentation
The Opentelemetry SDK is integrated into Rafiki to create, collect, and export metrics. The SDK integrates seamlessly with the OTEL Collector.
Prometheus - AMP
We use Amazon’s managed service for Prometheus (AMP) to collect data from the Telemetry cluster.
Note: AMP offers limited configuration options and cannot crawl data outside of AWS. This limitation led us to adopt a push model, using prometheusRemoteWrite, instead of a pull model. For future development, we may consider hosting our own Prometheus.
Grafana - Grafana Cloud
Grafana Cloud is used for data visualization dashboards. It offers multiple tools that extend Prometheus Promql.
Note: We initially used Amazon hosted Grafana, but it did not meet our needs for embedding dashboards. Grafana Cloud offers a feature called “Public dashboards”, which allows us to share dashboards. However, embedding may still pose a challenge.
Exchange Rates
For telemetry purposes, all amounts collected by instrumented Rafiki should be converted to a base currency.
Privacy Reasoning: If only two ASEs are peered over a non-USD currency and we collect data in that currency, it would be easy to determine the volumes moved between those two ASEs. To maintain privacy, we convert all amounts to a base currency.
If an ASE does not provide the necessary exchange rate for a transaction, the telemetry solution will still convert the amount to the base currency using external exchange rates. A Lambda function on AWS retrieves and stores these external exchange rates. It is triggered by a daily CloudWatch event and stores the rates in a public S3 Bucket. The S3 Bucket does not have versioning, and the data is overwritten daily to further ensure privacy.
Instrumentation
Rafiki currently has three counter metrics. All data points (counter increases and histogram records) are exported to collection endpoints at a configurable interval (default recommended to 15s).
Currently collected metrics:
transactions_total- Counter metric- Description: “Count of funded transactions”
- This counter metric increases by 1 for each successfully sent transaction.
transactions_amount- Counter metric- Description: “Amount sent through the network”.
- This amount metric increases by the amount sent in each ILP packet.
ilp_pay_time_ms- Histogram metric- Description: “Time to complete an ILP payment”
- This histogram metric records the time taken to make an ILP payment.
Note: The current implementation only collects metrics on the SENDING side of a transaction. Metrics for external open-payments transactions RECEIVED by a Rafiki instance in the network are not collected.